04 Jun Go with the Flow (Q2-19)
Economists tend to dismiss the role of credit in the economic cycle because of the lack of correlation between GDP growth and growth in the total amount of outstanding credit of the non-financial sector. In October 2009, the IMF forecast that credit growth would remain at historically low levels in the U.S. and that economic growth would therefore be constrained. The IMF was wrong: U.S. GDP did recover in 2010 before credit growth turned positive. Similarly, central bankers use economic models that do not allow for an interaction between credit markets and the real economy. The conventional approach to analyzing credit’s impact on aggregate demand in an economy has been to look at outstanding credit outstanding, also known as the “stock” of credit; however, as IMF economic forecasts based on credit stock have shown, the link to economic activity has been unreliable.
Credit investors know empirically that the demand for credit is pro-cyclical. Whether greater credit demand is the cause for economic upturns or merely correlated is a debate not frequently had in academic circles. In the first published paper that examines using credit data to forecast GDP growth, three economists from the Central Bank of Turkey[1] concluded that credit data can be used to not only explain the movements of GDP but also “nowcast” quarter-on-quarter GDP growth. Since most macroeconomic variables are made available to the public after considerable delay (sometimes months), credit data could be very valuable for early estimates of current GDP as it is available with only few days delay.
Comparing cycles in the stock of credit with cycles in the flow of GDP produces spurious outcomes. The Bank of International Settlements[2] used such a comparison to proclaim that credit cycles last longer and have much larger amplitudes than economic cycles, although empirical evidence shows these cycles are roughly of equal length. Michael Biggs and Thomas Mayer (“Biggs and Mayer”) of Deutsche Bank and Frankfurt University, respectively, argue that GDP is a flow measure and only comparable against another flow measure[3]. They use the second derivative of credit, the change in the flow of credit, rather than credit growth and show that GDP growth depends on whether the flow of credit, or new borrowing, is increasing or decreasing. They coined the phrase “credit impulse” to describe this flow of new credit in an economy.
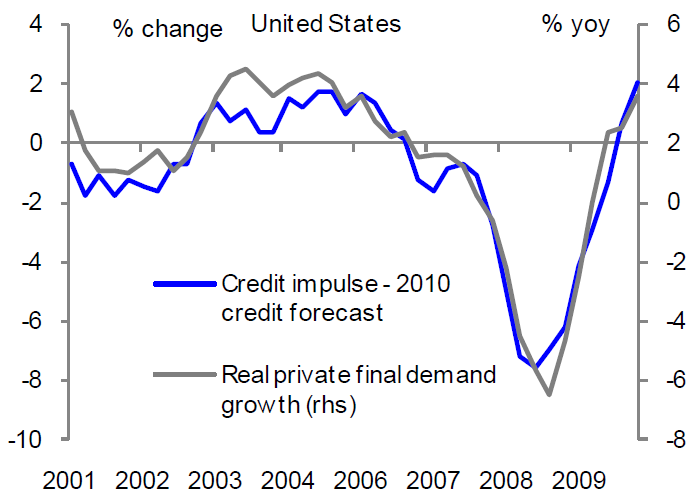
Biggs and Mayer examined the U.S. Great Depression, OECD countries that suffered a financial crisis, and the recent Great Financial Crisis (“GFC”), and found that the flow of credit resumes at the same time as the economy starts to recover (even if the stock of credit continued to decline). The relevance of the credit impulse rather than credit growth to real domestic demand growth was particularly evident in the U.S. in 2010 (Figure 1). Credit growth was negative in 2010 (even weaker than the IMF forecasted) but credit growth was less negative than in 2009 (flow of credit was positive), and real GDP growth and private sector demand grew 2.4% and 3.7%, respectively.

Figure 1. U.S. Credit impulse and demand growth
Source: Deutsche Bank, IMF
The implication of these findings is that after a credit crisis all that might be required for a recovery in demand growth is that new borrowing rises. The massive rise in new credit formations since the GFC have certainly characterized the last decade of economic growth. It has been demonstrated that, for many times periods and countries, credit impulse is a useful predictive indicator of GDP growth and other macroeconomic data that works with a lag of nine to twelve months.
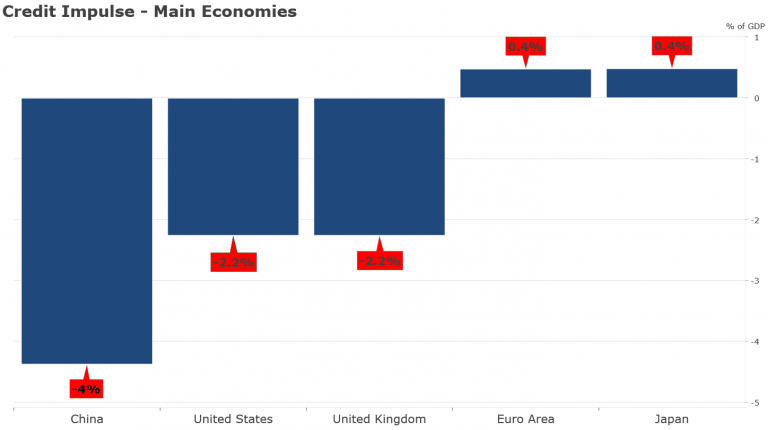
Tracking the credit impulse of a country provides a helpful assessment of where the economy is heading. Prior to the GFC, the U.S., Japan, and Europe were the main drivers of the global credit cycle; however, since 2009, China’s credit impulse has become a dominant factor. For 2017-2019, China’s contribution to global growth will reach 35%, equal to that of the U.S. India, and Europe combined. China is also the world’s largest consumer of industrial metals, accounting for half of global demand. China’s credit impulse is key to the evolution of the global economy. According to Saxo Bank, one of only a few institutions that regularly tracks the credit impulse of major economies, global credit impulse is falling and is at -1.8% of global GDP. Half of the countries that Saxo Bank tracks are in contraction and the other half (except India and Russia) are experiencing a deceleration in the flow of new credit. In developed countries, the trend is most concerning in the U.S. where credit impulse is at -2.2% of GDP, the lowest level since 2009 (Figure 2).

Figure 2. Credit impulse in major economies (April 2019)
Source: Saxo Bank
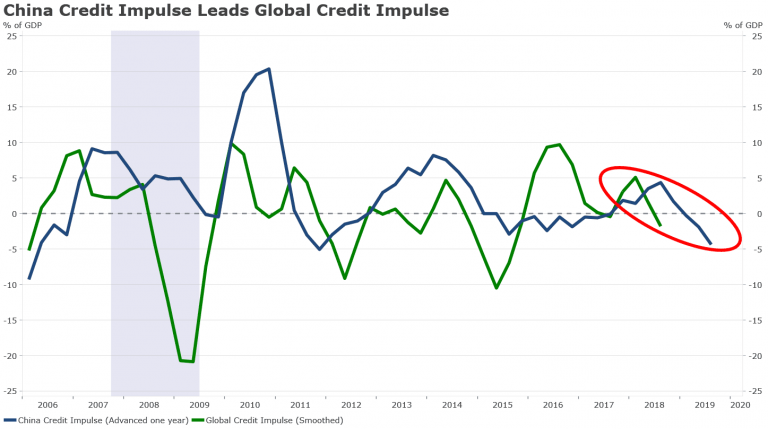
According to BCA Research, short-term credit impulses in the U.S., E.U., and China are all entering down-oscillations. Saxo Bank notes that China’s credit impulse tends to lead the global credit impulse by one year (Figure 3). Unless the flow of credit in China reverses due to a very targeted policy response, which in China is a strong possibility, we can expect lower global growth ahead.

Figure 3. Credit impulse in China and Globally (April 2019)
Source: Saxo Bank
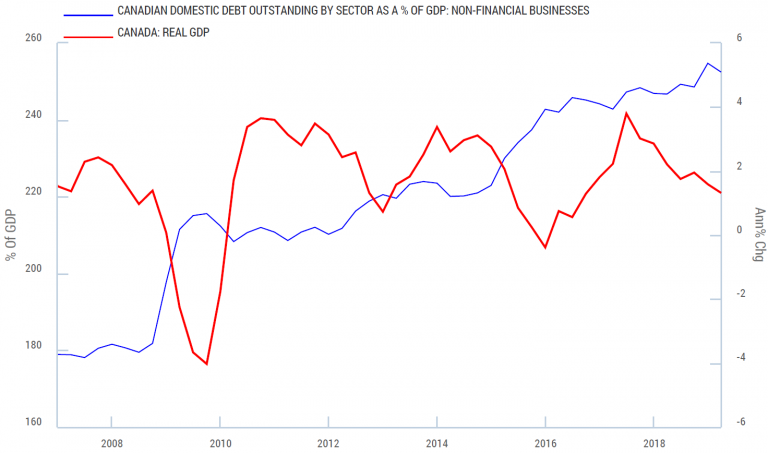
Since Q1-2010, a strong positive credit impulse in Canada has helped drive demand growth but a turn was inevitable given the record stock of indebtedness (Figure 4). By the end of Q4-2018, credit impulse in Canada was -1% of GDP, a potential signal for a further slowdown in GDP. In the Bank of Canada’s Q2-2019 Senior Bank Officer Survey; however, opinions on bank lending standards showed a slight easing of conditions, which does not confirm any shift in credit availability that might curtail new loan originations. Credit demand is receding in parts of Canada, especially in British Columbia and the Prairies where sentiment on the economic outlook is softening, so the national credit impulse is worth tracking closely.

Figure 5. U.S. Institute of Supply Management Indices (July 2019)
Source: BCA Research
Higher trade tariffs negatively impact corporate confidence, capex intentions, and near-term global growth. Trade policy has proven to influence the Fed’s deliberations. We disagree with the consensus view that the Trump administration will reach a resolution of China-U.S. trade tensions in order to improve re-election prospects. We believe U.S. President Donald Trump considers the U.S. stock market as his report card and thinks aggressive Fed stimulus is necessary to keep risk assets afloat. What better way of coaxing more cuts out of the Fed in the near-term than by escalating trade tensions?
Corporate fundamentals in the U.S. are weak. Results from second quarter reporting season shows that there have been 3.5 negative earnings revisions for every upward revision. Seventy-two percent of S&P500 companies issued negative earnings guidance for Q3-2019, which is above the 5-year average of 70%. Corporate debt as a share of GDP is at the highest level in the post-war era. Based on Compustat data that captures nearly 2,000 publicly-traded firms and covers the years 1999 through to 2018, non-financial corporate debt relative to both EBITDA and total assets are also well above their historical averages. Smaller companies have more debt and lower margins than larger ones. Approximately 600 of the Russell 2000 have no forward profits (note these companies are omitted from the forward P/E calculation of the index, understating how expensive valuations are in the small cap market).
Economic crises are severe but uncommon, which is why imbalances are not recognized until it is usually too late. The surge in risky lending evokes memories of the subprime mortgage build that helped trigger the GFC. The Fed will not be patient about letting such imbalances grow and we think they will keep financial conditions easy to sustain an economic expansion. We believe more rate cuts and excess money growth will cause a final blowoff top in credit markets. The Fed is not a cure-all – no matter what it does, a recession is coming.
[1] Ermisoglu, Ergun, Akcelik, Yasin, Oduncu, Arif (2013). “GDP Growth and Credit Data”. Central Bank of the Republic of Turkey, Working Paper No. 13/27.
[2] Borio, Claudio (2012). “The financial cycle and macroeconomics: What have we learnt?” BIS Working Papers No. 395
[3] Biggs, Michael, Mayer, Thomas (2010). “Bring credit bank into the monetary policy framework!” Political Economy of Financial Markets, Oxford University, Policy Brief.


